MATPLOLIB: 데이터 시각화(2)
Chapter 02에서 배울 내용
- Basic plots
- Scatter plots
- Other plots
03-1 Boxplot
Boxplot은 비모수적인 그래프입니다. 표본의 분포를 보여주긴 하지만 어떠한 통계학적 분포를 가정하며 그래프를 작성하지는 않습니다. Boxplot을 그리기 위해서는 seaborn 패키지가 필요합니다.
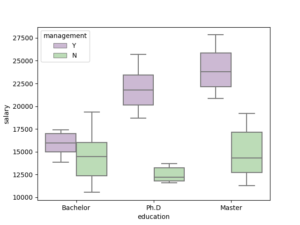
import seaborn as sns

sns.boxplot(x='education', y='salary', hue='management', data=salary, palette="PRGn")
plt.show()
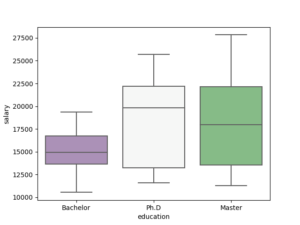
sns.boxplot(x='education', y='salary', data=salary, palette='PRGn')
plt.show()
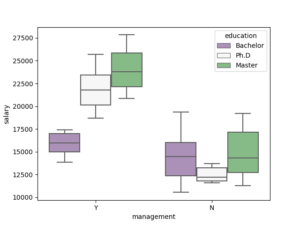
sns.boxplot(x='management', y='salary', hue='education', data=salary, palette='PRGn')
plt.show()
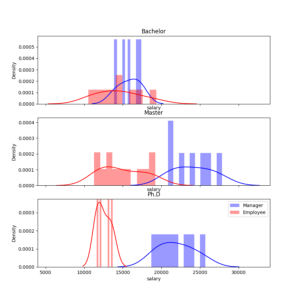
03-2 Density plot
# Set up the matplotlib figure: 3 x 1 axis
f, axes = plt.subplots(3, 1, figsize=(9, 9), sharex=True)

i = 0
for edu, d in salary.groupby(['education']):
    sns.distplot(d.salary[d.management == "Y"], color="b", bins=10, label="Manager",  ax=axes[i])
    sns.distplot(d.salary[d.management == "N"], color="r", bins=10, label="Employee", ax=axes[i])
    axes[i].set_title(edu)
    axes[i].set_ylabel('Density')
    i += 1
plt.legend()
plt.show()