
[Tensorflow] 06 Softmax Classification: Multinomial classification
이론
01. 개요
Logistic classification이 데이터를 0과 1, 즉 이분법적으로 분류하는 것이라면 Multinomial classfication은 데이터를 더 많은 Label(혹은 Class)로 분류하는 것입니다. 성적을 줄 때 A, B, C 등으로 분류하는 것이 실생활 속의 대표적인 예입니다. Multinomial classification을 받아들이는 것은 어쩌면 Logistic classification을 처음 접할 때보다 쉬울지도 모릅니다. 그 이론을 그대로 끌고 가기 때문이죠.
우리는 지난 Logistic Regression에서 두 집단을 분류하는 방법을 배웠습니다. 하나의 ‘선’을 통해 말입니다.
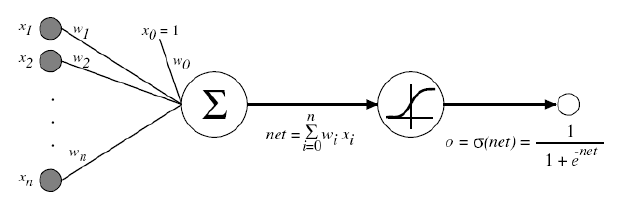
어떻게든 Cost의 값을 줄이고자 하였고 그 과정에서 Sigmoid 함수를 이용하였습니다. 이 Sigmoid 함수는 Multinomial classification에서도 적용됩니다. Multinomial classification은 Logistic classification의 연장선입니다. Multinomial classfication에서 Label이 A, B, C가 있다고 합시다. Logistic classification의 과정을 3번 거치면 우리는 Multinomial classification의 목표점에 도달할 수 있습니다. 다시 말해 데이터를 A와 not A, B와 not B, C와 not C로 분류하게 되면 모든 데이터를 A, B, C로 분류할 수 있게 되는 것입니다. 다시 말해 각각에 대한 Sigmoid 함수를 찾는 것이 이번 단원의 핵심입니다.
02. 전개
01) Hypothesis
머신러닝의 기본은 역시 가설입니다. 가설의 다른 말은 늘 예측값이었습니다. 예측값과 실제값의 차이를 Cost라 불렀고 Cost의 크기를 최대한 작게 하는 것이 머신러닝의 기본적인 배경입니다. A, B, C 예시를 그대로 가지고 갑시다. A, B, C 각각에 대한 Sigmoid 함수를 따로따로 만들기에는 너무나 번거로우므로 우리는 행렬을 통해 한번에 함수를 만들 것입니다. 그렇다면 우선 3개의 가설 역시 한번에 만들 필요가 있습니다.
가설의 형태는 이전과 동일합니다.
는 하나의 예측값을 의미합니다.
은 각각 A, B, C에 치우친 정도라고 생각하면 쉽습니다.
는 그때 해당 Grade를 가질 확률입니다.
를 조작한
가 우리가 원하는 진짜 가설이 됩니다. 그리고 확률 전체의 합은 당연히 1이 되어야겠지요?
| Grade | ||
| 2.0 | 0.7 | A |
| 1.0 | 0.2 | B |
| 0.1 | 0.1 | C |
위의 예에서 A, B, C로 각각 2.0, 1.0, 0.1의 비율로 치우쳐져 있습니다. 이를 확률, 다시 말해 우리가 원하는 가설로 바꿔주는 것이 Softmax() 함수입니다. Softmax() 는 TensorFlow에서 제공해주는 Sigmoid 함수의 형태입니다. 다음과 같은 형태를 가진다고 합니다만 중요치는 않습니다.
이 함수를 통과하면 가
로 바뀐다는 것만 기억하면 됩니다. Scores가 Possibilities로 변하는 것입니다.
우리가 최종적으로 원하는 것은 Grade 입니다. 결국 3개의 Label 중 가장 가능성 높은 것을 선택하여 학습해야 합니다. 이를 선택해주는 것이 argmax()라는 함수입니다. argmax()를 거쳐 하나만 선택하는 것을 One-Hot Encoding 이라고 표현합니다.
| One-Hot | Grade | |
| 0.7 | 1.0 | A |
| 0.2 | 0.0 | B |
| 0.1 | 0.0 | C |
02) Cost function
Cost의 Square는 더이상 정확하게 Cost를 최소화시킬 수 없다는 것은 이미 지난 시간에 알아보았습니다. 이 때의 Cost function은 다음과 같습니다.
이때 는 Softmax() 함수를 통과한
가 담긴 행렬이고,
은 실제값
가 담긴 행렬입니다. 여기서 주의할 점은 행렬과 행렬의 곱으로 이루어져 있긴 하지만 여기서는 행렬의 연산을 해서는 안됩니다. Grade A, B, C는 서로 독립적이고 우리는 그냥 한번에 구하기 위하여 행렬에 담아놓은 것 뿐입니다. 즉 다시 말해 1행은 1행끼리, 2행은 2행끼리… 행끼리 곱셈 연산이 이루어져야 한다는 뜻입니다. log 연산도 마찬가지입니다. 행렬에 어떻게 로그를 씌우겠습니까.
* 위와 같은 함수를 Cross-entropy cost function 이라고 합니다. 구체적인 설명은 아래 링크를 참조하겠습니다. 여기서는 예시를 통해 이 Cost function이 사용하기에 충분하다는 것만을 이야기하겠습니다. <fn>http://blog.naver.com/gyrbsdl18/221013188633</fn>
링크 ::: http://blog.naver.com/gyrbsdl18/221013188633
예시
: 실제값이 B 인 경우입니다.
① : 실제값을 정확하게 예측한 경우입니다.
정확하게 예측할 경우 Cost의 값이 0이 됩니다.
② : 실제값과 반대로 예측한 경우입니다.
반대로 예측할 경우 Cost의 값은 매우 커집니다.
따라서 우리는 을 충분히 사용 가능합니다.
최종적인 Cost function은 아래와 같이 될 것입니다.
03) Gradient Descent Algorithm
Gradient Descent Algorithm을 적용할 준비를 모두 끝마쳤습니다.
실습
이번 실습은 코드 내에서 데이터를 직접 입력하지 않고 외부에서 데이터(csv 파일)를 받아와보도록 하겠습니다. 이를 위해서는 일단 numpy 라이브러리가 필요합니다. 아래 링크에서는 해당 라이브러리를 설치하는 방법이 소개되어 있습니다.
윈도우 – python에 numpy 설치하기 :: http://egloos.zum.com/erza/v/4309628
이번 실습에 사용될 데이터는 동물들에 관한 데이터입니다. 동물들의 16개 특성들(털이 있는지, 이빨이 있는지, 다리가 몇개인지 등)이 x 데이터에 담겨 있고 이런 특성을 토대로 101마리의 동물을 7가지 종으로 분류하고 있습니다. 즉, 여기서 Label = 7이 되겠습니다.
import tensorflow as tf
import numpy as np

xy = np.loadtxt("C:\\python_data\\Stduying\\data-zoo.csv", delimiter=",", dtype=np.float32)
x_data = xy[:90, 0:-1]
y_data = xy[:90, [-1]]

x_test = xy[90:, 0:-1]
y_test = xy[90:, -1:]

print(x_data.shape, y_data.shape)
# output: (90, 16) (90, 1)

X = tf.placeholder(tf.float32, [None, 16])
Y = tf.placeholder(tf.int32, [None, 1])
numpy의 loadtxt()에 대한 설명은 다음을 참조하세요.
numpy.loadtxt() :: https://docs.scipy.org/doc/numpy/reference/generated/numpy.loadtxt.html
이번 실습에서는 훈련용 테이터(x_data, 90개)와 테스트용 데이터(x_test, 11개)를 따로 구분해놓았습니다. 먼저 훈련용 데이터만 주어서 충분히 머신러닝을 시킨 후 이전까지 본적 없던 새로운 데이터인 테스트용 데이터를 주어서 모델이 잘 만들어졌는데 데스트를 해보겠습니다.
# Label: 0~6
nb_labels = 7

Y_one_hot = tf.one_hot(Y, nb_labels)
# one_hot: r=2 -> r=3
Y_one_hot = tf.reshape(Y_one_hot, [-1, nb_labels])
y의 raw data는 현재 0~6의 정수로 이루어져있습니다. Softmax classification에서 우리가 쓸 데이터는 One-Hot-Encoding이 된 상태여야 합니다. 우리는 y_data를 Y에 대입할 때 Y가 One-Hot-Coding 상태로 y_data를 받아들이게 해야 합니다. 이때 one_hot() 함수를 사용합니다.
one_hot() 함수 알아보기
[show_more more=”더 읽기 ↓” less=”닫기”]
one_hot(
    indices,
    depth,
    on_value=None,
    off_value=None,
    axis=None,
    dtype=None,
    name=None
)
Args
– indicies: One-Hot-Encoding 시키고 싶은 Tensor
– depth: Label 수
– on_value: 해당 Label을 가질 때 나타낼 값(초기값: 1)
– of_value: 해당 Label을 가지지 않을 때 나타낼 값(초기값: 0)
– axis는 무엇을 의미할까요…
Return
– 하나의 one-hot Tensor
그런데 one_hot() 함수는 차원을 하나 높인다고 합니다.
import tensorflow as tf

y = [[0],[1],[2],[1],[2]]
y_one_hot = tf.one_hot(y, depth=3)

with tf.Session() as sess:
    print(y_one_hot)
    print(sess.run(y_one_hot))
* 출력값: Tensor(“one_hot:0”, shape=(5, 1, 3), dtype=float32)
[[[ 1. 0. 0.]]
[[ 0. 1. 0.]]
[[ 0. 0. 1.]]
[[ 0. 1. 0.]]
[[ 0. 0. 1.]]]
우리가 지금 필요한 건 shape=(5, 3)의 데이터인데 굳이 3개의 원소가 담긴 1차원 배열 1개가 2차원 배열을 이루고 2차원 배열 5개가 모여 3차원 배열이 되었습니다. reshape() 함수로 간단하게 Tensor의 shape을 변형시킬 수 있습니다.
import tensorflow as tf

y = [[0],[1],[2],[1],[2]]
y_one_hot = tf.one_hot(y, depth=3)

# 이 한줄을 추가합니다.
y_one_hot = tf.reshape(y_one_hot, [-1, 3])

with tf.Session() as sess:
    print(y_one_hot)
    print(sess.run(y_one_hot))
* 출력값
Tensor(“Reshape:0”, shape=(5, 3), dtype=float32)
[[ 1. 0. 0.]
[ 0. 1. 0.]
[ 0. 0. 1.]
[ 0. 1. 0.]
[ 0. 0. 1.]]
[/show_more]
reshape() 함수 알아보기
[show_more more=”더 읽기 ↓” less=”닫기”]
reshape(
    tensor,
    shape,
    name=None
)
Args
– 우리가 바꾸고자 Shape로 Tensor를 바꿉니다.
Return
– Tensor
이 함수에서 주목할 점은 shape입니다. 예시를 그대로 가져오겠습니다.
Example
# tensor 't' is [1, 2, 3, 4, 5, 6, 7, 8, 9]
# tensor 't' has shape [9]
reshape(t, [3, 3]) ==> [[1, 2, 3],
                        [4, 5, 6],
                        [7, 8, 9]]

# tensor 't' is [[[1, 1], [2, 2]],
#                [[3, 3], [4, 4]]]
# tensor 't' has shape [2, 2, 2]
reshape(t, [2, 4]) ==> [[1, 1, 2, 2],
                        [3, 3, 4, 4]]

# tensor 't' is [[[1, 1, 1],
#                 [2, 2, 2]],
#                [[3, 3, 3],
#                 [4, 4, 4]],
#                [[5, 5, 5],
#                 [6, 6, 6]]]
# tensor 't' has shape [3, 2, 3]
# pass '[-1]' to flatten 't'
reshape(t, [-1]) ==> [1, 1, 1, 2, 2, 2, 3, 3, 3, 4, 4, 4, 5, 5, 5, 6, 6, 6]

# -1 can also be used to infer the shape

# -1 is inferred to be 9:
reshape(t, [2, -1]) ==> [[1, 1, 1, 2, 2, 2, 3, 3, 3],
                         [4, 4, 4, 5, 5, 5, 6, 6, 6]]
# -1 is inferred to be 2:
reshape(t, [-1, 9]) ==> [[1, 1, 1, 2, 2, 2, 3, 3, 3],
                         [4, 4, 4, 5, 5, 5, 6, 6, 6]]
# -1 is inferred to be 3:
reshape(t, [ 2, -1, 3]) ==> [[[1, 1, 1],
                              [2, 2, 2],
                              [3, 3, 3]],
                             [[4, 4, 4],
                              [5, 5, 5],
                              [6, 6, 6]]]

# tensor 't' is [7]
# shape `[]` reshapes to a scalar
reshape(t, []) ==> 7
더욱 주목해야할 점은 -1 인데요. -1 은 flatten의 기능 뿐만 아니라 shape를 유추(infer)하는 기능도 있습니다. 우리는 위에서 Shape 내에 -1 값을 전달함으로써 reshaping 시켰습니다.
[/show_more]
우리의 코드를 보겠습니다. 변수를 만들어 줍니다.
W = tf.Variable(tf.random_normal([16, nb_labels]), name="weight")
b = tf.Variable(tf.random_normal([nb_labels]), name="bias")
hypothesis를 구해줍니다. 다만 예측값을 그 상태로 이용하지 못하고 Sigmoid 함수(Softmax 함수)를 이용하여 확률의 형태로 바꾸어준다고 하였습니다.
scores = tf.matmul(X, W) + b
possibility = tf.nn.softmax(scores)
여기서 possibility 가 우리가 원하는 진짜 가설입니다. 명칭을 일단 바꿉시다.
hypothesis = possibility
이제 거의 다왔습니다. Cost function을 만들고 Cost를 Minimize 시키기 위한 코드를 짭니다.
cost = tf.reduce_mean(-tf.reduce_sum(Y*tf.log(hypothesis)))
train = tf.train.GradientDescentOptimizer(learning_rate=0.01).minimize(cost)
모델이 잘 만들어졌는지 알아보기 위해 prediction과 accuracy를 만듭니다.
prediction = tf.argmax(hypothesis, 1)
prediction_corrected = tf.equal(tf.argmax(Y_one_hot, 1), prediction)
accuracy = tf.reduce_mean(tf.cast(prediction_corrected, tf.float32))
argmax() 함수 알아보기
[show_more more=”더 읽기 ↓” less=”닫기”]
위에서 언급한 argmax() 함수를 이용합니다. argmax()는 One-Hot-Coding 된 상태에서 하나의 Grade를 뽑아주는 것이라고 위에서 이야기하였습니다. 정확히 argmax() 은 One-Hot-Encoding 된 상태에서 On_value의 값을 가지는 “위치”를 리턴해줍니다. <fn>http://pythonkim.tistory.com/73</fn>
argmax(
    input,
    axis=None,
    name=None,
    dimension=None
)
Args
– axis: 0 -> 열, 1 -> 행, 2 -> 면
[/show_more]
argmax() 함수를 이용해서 Y_one_hot 역시 다시 디코딩 해주고 이를 prediction과 비교하여 그 값을 prediction_corrected에 저장하기로 합시다. 마지막으로 Accuracy op 에서는 prediction_corrected에 담겨진 True, False 값을 float32 타입으로 cast 하고 전체의 평균을 구해 정확도를 측정해보기로 합시다.
이제 세션 상에서 실행시켜줍니다.
with tf.Session() as sess:
    sess.run(tf.global_variables_initializer())

    for step in range(2001):
        cost_val, accuracy_val, _ = sess.run([cost, accuracy, train], feed_dict={X: x_data, Y: y_data})
        if step % 100 == 0:
             print("Step: ", step)
             print("Cost: ", cost_val)
             print("Accuracy: ", accuracy_val)
* 출력값 중 일부만을 가져왔습니다.
Step: 0
Cost: 8.08486
Accuracy: 0.0375
Step: 500
Cost: 1.06017
Accuracy: 0.7375
Step: 1000
Cost: 0.551489
Accuracy: 0.875
Step: 1500
Cost: 0.401929
Accuracy: 0.8875
Step: 2000
Cost: 0.318436
Accuracy: 0.9125
훈련이 진행될수록 Accuracy가 증가함을 알 수 있습니다.
이번 실습에서 우리는 훈련용 데이터(80개)와 테스트용 데이터를 나누었습니다. 우리가 만들어낸 모델을 테스트해보고자 합니다.
    pred = sess.run(prediction, feed_dict={X: x_test})
    for p, y in zip(pred, y_test.flatten()):
        print("[{}] Prediction: {} True Y: {}".format(p==int(y), p, int(y)))
* 출력값
[False] Prediction: 1 True Y: 2
[False] Prediction: 0 True Y: 2
[True] Prediction: 3 True Y: 3
[True] Prediction: 0 True Y: 0
[True] Prediction: 0 True Y: 0
[True] Prediction: 1 True Y: 1
[True] Prediction: 0 True Y: 0
[True] Prediction: 5 True Y: 5
[True] Prediction: 0 True Y: 0
[False] Prediction: 3 True Y: 6
[True] Prediction: 1 True Y: 1
11개 중 8개를 맞추었습니다.
# Lab 6 Softmax Classifier
import tensorflow as tf
import numpy as np
tf.set_random_seed(777)  # for reproducibility

# Predicting animal type based on various features
xy = np.loadtxt('data-04-zoo.csv', delimiter=',', dtype=np.float32)
x_data = xy[:, 0:-1]
y_data = xy[:, [-1]]

print(x_data.shape, y_data.shape)

nb_classes = 7  # 0 ~ 6

X = tf.placeholder(tf.float32, [None, 16])
Y = tf.placeholder(tf.int32, [None, 1])  # 0 ~ 6
Y_one_hot = tf.one_hot(Y, nb_classes)  # one hot
print("one_hot", Y_one_hot)
Y_one_hot = tf.reshape(Y_one_hot, [-1, nb_classes])
print("reshape", Y_one_hot)

W = tf.Variable(tf.random_normal([16, nb_classes]), name='weight')
b = tf.Variable(tf.random_normal([nb_classes]), name='bias')

# tf.nn.softmax computes softmax activations
# softmax = exp(logits) / reduce_sum(exp(logits), dim)
logits = tf.matmul(X, W) + b
hypothesis = tf.nn.softmax(logits)

# Cross entropy cost/loss
cost_i = tf.nn.softmax_cross_entropy_with_logits(logits=logits,
                                                 labels=Y_one_hot)
cost = tf.reduce_mean(cost_i)
optimizer = tf.train.GradientDescentOptimizer(learning_rate=0.1).minimize(cost)

prediction = tf.argmax(hypothesis, 1)
correct_prediction = tf.equal(prediction, tf.argmax(Y_one_hot, 1))
accuracy = tf.reduce_mean(tf.cast(correct_prediction, tf.float32))
# Launch graph
with tf.Session() as sess:
    sess.run(tf.global_variables_initializer())

    for step in range(2000):
        sess.run(optimizer, feed_dict={X: x_data, Y: y_data})
        if step % 100 == 0:
            loss, acc = sess.run([cost, accuracy], feed_dict={
                                 X: x_data, Y: y_data})
            print("Step: {:5}\tLoss: {:.3f}\tAcc: {:.2%}".format(
                step, loss, acc))

    # Let's see if we can predict
    pred = sess.run(prediction, feed_dict={X: x_data})
    # y_data: (N,1) = flatten => (N, ) matches pred.shape
    for p, y in zip(pred, y_data.flatten()):
        print("[{}] Prediction: {} True Y: {}".format(p == int(y), p, int(y)))